Jmeter recording
How to create Jmeter scripts?
Recording Jmeter scripts using Jmeter’s HTTP(S) Test Script recorder. There are two ways
1) Manually adding scripts ( Test plan >> Tread Group >> Add>> Sampler >> HTTP Request )
2) Recording using Jmeter’s HTTP(S) Test Script recorder
How to record Jmeter scripts using HTTP(S) Test Script recorder
Prior doing that we need to configure browser and learn about the Proxy setup
Jmeter to Application server communication need to be routed through a browser Proxy for this recording purpose. For that you may need to select the Browser (here we can use Firefox browser”
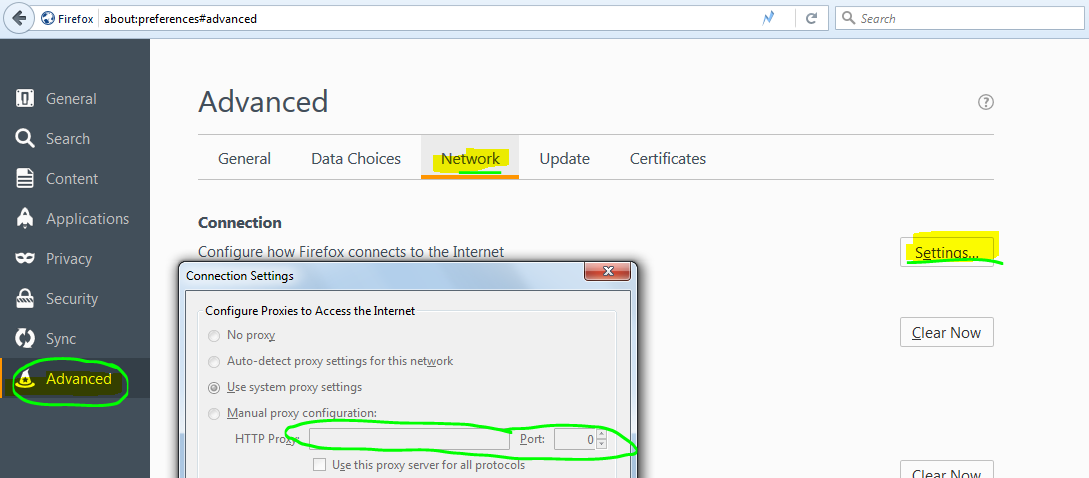
1) Navigate to Firefox >> Tools >> options >> Advanced >> Network >> Settings
2) Select Manual Proxy configuration >> HTTP Proxy = localhost & Port = 8080
3) Once this configuration is made – create Recording controller
Path ==> Test plan >> Tread Group >> Add>> Logic Controller >> Recording controller

Recording controller will look like as below:

4) Now add the HTTP(S) Test Script recorder

HTTP(S) Test Script recorder will look like as below:

Also make sure the URL patterns to be included. I need only .html so added as below,

5) Now click on Start button and type on the Firefox browser with input url name and subsequent actions that you want to consider for performance test recording.

Jmeter tutorial on Jmeter components, terminologies etc
1. Thread group – refers the virtual users count applied while performance testing using Jmeter.
How we design the user transactions or thread group?
1) The requirement is given that 60 user transactions needs to be made. And requested for 3 sec interval between transactions
2) Then Ram up time should be set 180 sec. This will fulfill the requirement of 3 sec delay between transactions
3) This will also ensure that the 60th thread or user will be starting the action at 180th sec. ( i.e Ramp up time / number of users – will give you the time interval for each uses to kick off. Total ramp up time will be the total time to start all transactions including the 60th one. Based on the transaction scenario length probably first set of 1 to 50th ones may be finished by this time) – similar articles on Jmeter , script Recording
2. Samplers
Samplers are transaction makers which will let you send transactions.
For e.g HTTP Request sampler is used, it will send HTTP/HTTPS request to the web server. This requests can be manually added or recorded using HTTP(S) Test Script Recorder.
Web embedded resources like CSS, images, java applets, scripts, background images are retrieved by HTTP requests.
similar article on Jmeter
3. Test plan
Test plan is the container of all the performance test scenarios and components of the particular test in Jmeter. Test plan consists of Thread group , temporary work bench, Samplers, etc.
How to create Jmeter scripts?
Recording Jmeter scripts using Jmeter’s HTTP(S) Test Script recorder. There are two ways
1) Manually adding scripts ( Test plan >> Tread Group >> Add>> Sampler >> HTTP Request )
2) Recording using Jmeter’s HTTP(S) Test Script recorder
How to record Jmeter scripts using HTTP(S) Test Script recorder
Prior doing that we need to configure browser and learn about the Proxy setup
Jmeter to Application server communication need to be routed through a browser Proxy for this recording purpose. For that you may need to select the Browser (here we can use Firefox browser”
1) Navigate to Firefox >> Tools >> options >> Advanced >> Network >> Settings
2) Select Manual Proxy configuration >> HTTP Proxy = localhost & Port = 8080
3) Once this configuration is made – create Recording controller
Path ==> Test plan >> Tread Group >> Add>> Logic Controller >> Recording controller
Recording controller will look like as below:
4) Now add the HTTP(S) Test Script recorder
HTTP(S) Test Script recorder will look like as below:
Also make sure the URL patterns to be included. I need only .html so added as below,
5) Now click on Start button and type on the Firefox browser with input url name and subsequent actions that you want to consider for performance test recording.
Jmeter scripts Adding scripts manually
Apache JMeter is a Java based performance testing tool works well on web communication layer (HTTP).
How to create Jmeter scripts?
There are two ways
1) Manually adding scripts ( Test plan >> Tread Group >> Add>> Sampler >> HTTP Request )
2) Recording using Jmeter’s HTTP(S) Test Script recorder
How to manually add Jmeter scripts
1 Follow the path : Test plan >> Tread Group >> Add>> Sampler >> HTTP Request as copied in the below screenshot

Below the fields needs to be filled when you write a code,
1) Name: you can give any logical name based on application (e.g Login, Home page etc)
2) Server Name or IP : it’s nothing but the IP of your server or the url name (www.your test site.com or “your test site.com” as example or if you know the IP, provide the IP)
3) Path : is “/sso/auth” in this example screenshot below as the remaining contents in the url after “.com” – if your original site is www.your test site.com/sso/auth
4) Make sure the Method è POST and protocol can be HTTP or HTTPS – which ever protocol is used.

Jmeter Performance test scenario – Creating a Jmeter Performance test scenario
Thread Group: Thread group is the number of virtual users performing the transaction on application under test.
How to add Thread group?
- Right click on the TestPlan
- Select Add>Thread Group from the popup.

How we design the user transactions or thread group?
As per below screenshot –
1) The requirement shows that number of threads or user actions needed as 60
2) Ram up time is given as 180 sec
3) This indicates that a delay of 3 sec between transactions are applied.
This will ensure that the 60th thread or user will be starting the action at 180th sec.
Here this example is selected based on user requirement or to verify performance metrics.

Jmeter Installation steps
- Download JMeter from (http://jmeter.apache.org/download_jmeter.cgi ) è by clicking the on the “apache-jmeter-2.13_src.zip md5 pgp” link (Binaries or Source)
- Extract the contents to a folder from ZIP file.
- Open the DOS command prompt (Flow: click on Start menu, Type cmd).
- In DOS screen – Navigate to the <JmeterHome>\bin directory.

- Type Jmeter.bat in the above mentioned command prompt. That will bring the Jmeter application ready for performance testing.

- Or click on Jmeter.bat file listed in <JmeterHome>\bin should bring the application.

Apache JMeter features and uses:
Apache JMeter is a performance tool developed in Java.
Supports both load and performance tests,
Supports different applications/server/protocol types,
Web – HTTP, HTTPS – i.e application made in Java, NodeJS, PHP, ASP.NET etc
SOAP / REST Webservices, FTP , LDAP & TCP etc.
Additionally it supports Database via JDBC, Message-oriented middleware via JMS, Mail – SMTP(S), POP3(S) and IMAP(S), also Native commands or shell scripts & Java Objects