
Apache Jmeter key topics for basic level users
Jmeter is an open source performance testing tool. Popularity is increasing on this tool now a days as reports can be extended and customized by doing little more programming on it.
Installation steps:
- Download JMeter from (http://jmeter.apache.org/download_jmeter.cgi ) è by clicking the on the “apache-jmeter-2.13_src.zip md5 pgp” link (Binaries or Source)
- Extract the contents to a folder from ZIP file.
- Open the DOS command prompt (Flow: click on Start menu, Type cmd).
- In DOS screen – Navigate to the <JmeterHome>\bin directory.
Note : for Jmeter components or terminologies refer components

- Type Jmeter.bat in the above mentioned command prompt. That will bring the Jmeter application ready for performance testing.
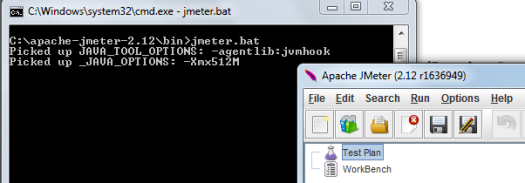
- Or click on Jmeter.bat file listed in <JmeterHome>\bin should bring the application.

Creating a Performance test scenario
Thread Group: Thread group is the number of virtual users performing the transaction on application under test.
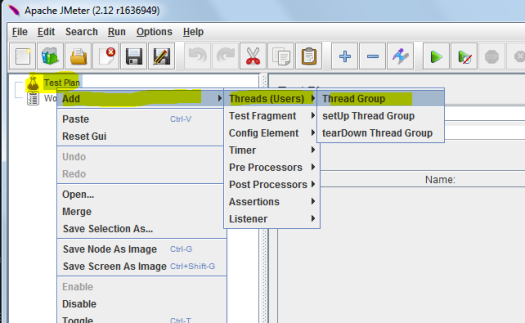
How to add Thread group?
- Right click on the TestPlan
- Select Add>Thread Group from the popup.
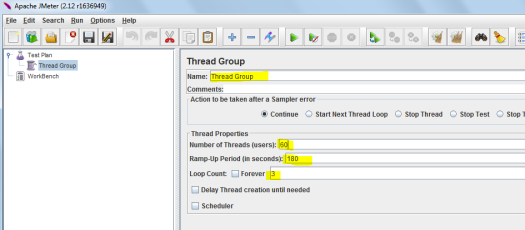
How we design the user transactions or thread group?
As per below screenshot –
1) The requirement shows that number of threads or user actions needed as 60
2) Ram up time is given as 180 sec
3) This indicates that a delay of 3 sec between transactions are applied.
This will ensure that the 60th thread or user will be starting the action at 180th sec.
Here this example is selected based on user requirement or to verify performance metrics.
How to create Jmeter scripts?
There are two ways
1) Manually adding scripts ( Test plan >> Tread Group >> Add>> Sampler >> HTTP Request )
2) Recording using Jmeter’s HTTP(S) Test Script recorder
How to manually add Jmeter scripts
1 Follow the path : Test plan >> Tread Group >> Add>> Sampler >> HTTP Request as copied in the below screenshot

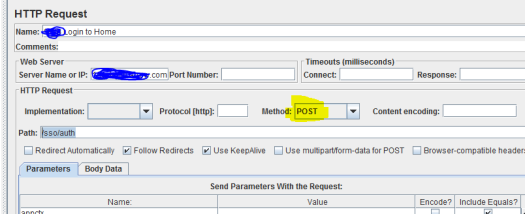
Below the fields needs to be filled when you write a code,
1) Name: you can give any logical name based on application (e.g Login, Home page etc)
2) Server Name or IP : it’s nothing but the IP of your server or the url name (www.your test site.com or “your test site.com” as example or if you know the IP, provide the IP)
3) Path : is “/sso/auth” in this example screenshot below as the remaining contents in the url after “.com” – if your original site is www.your test site.com/sso/auth
4) Make sure the Method è POST and protocol can be HTTP or HTTPS – which ever protocol is used.
How to record Jmeter scripts
Prior doing that we need to configure browser and learn about the Proxy setup
Jmeter to Application server communication need to be routed through a browser Proxy for this recording purpose. For that you may need to select the Browser (here we can use Firefox browser”
1) Navigate to Firefox >> Tools >> options >> Advanced >> Network >> Settings
2) Select Manual Proxy configuration >> HTTP Proxy = localhost & Port = 8080

3) Once this configuration is made – create Recording controller
Path ==> Test plan >> Tread Group >> Add>> Logic Controller >> Recording controller
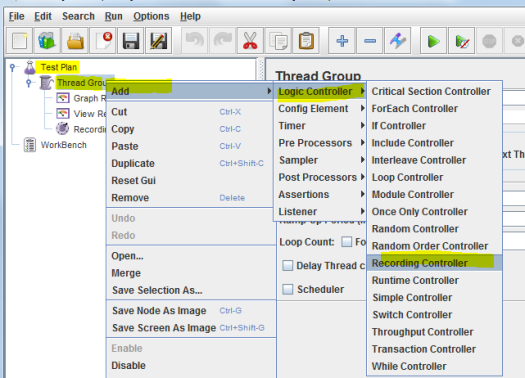
Recording controller will look like as below:

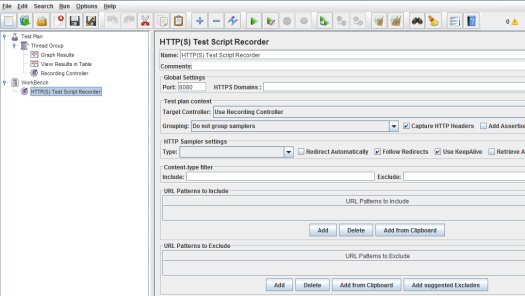
4) Now add the HTTP(S) Test Script recorder

HTTP(S) Test Script recorder will look like as below:

Also make sure the URL patterns to be included. I need only .html so added as below,
5) Now click on Start button and type on the Firefox browser with input url name and subsequent actions that you want to consider for performance test recording.

Jmeter tutorial on Jmeter components, terminologies etc
1. Thread group – refers the virtual users count applied while performance testing using Jmeter.
How we design the user transactions or thread group?
1) The requirement is given that 60 user transactions needs to be made. And requested for 3 sec interval between transactions
2) Then Ram up time should be set 180 sec. This will fulfill the requirement of 3 sec delay between transactions
3) This will also ensure that the 60th thread or user will be starting the action at 180th sec. ( i.e Ramp up time / number of users – will give you the time interval for each uses to kick off. Total ramp up time will be the total time to start all transactions including the 60th one. Based on the transaction scenario length probably first set of 1 to 50th ones may be finished by this time) – similar articles on Jmeter , script Recording
2. Samplers
Samplers are transaction makers which will let you send transactions.
For e.g HTTP Request sampler is used, it will send HTTP/HTTPS request to the web server. This requests can be manually added or recorded using HTTP(S) Test Script Recorder.
Web embedded resources like CSS, images, java applets, scripts, background images are retrieved by HTTP requests.
similar article on Jmeter
3. Test plan
Test plan is the container of all the performance test scenarios and components of the particular test in Jmeter. Test plan consists of Thread group , temporary work bench, Samplers, etc.
How to create Jmeter scripts?
Recording Jmeter scripts using Jmeter’s HTTP(S) Test Script recorder. There are two ways
1) Manually adding scripts ( Test plan >> Tread Group >> Add>> Sampler >> HTTP Request )
2) Recording using Jmeter’s HTTP(S) Test Script recorder
How to record Jmeter scripts using HTTP(S) Test Script recorder
Prior doing that we need to configure browser and learn about the Proxy setup
Jmeter to Application server communication need to be routed through a browser Proxy for this recording purpose. For that you may need to select the Browser (here we can use Firefox browser”
1) Navigate to Firefox >> Tools >> options >> Advanced >> Network >> Settings
2) Select Manual Proxy configuration >> HTTP Proxy = localhost & Port = 8080
3) Once this configuration is made – create Recording controller
Path ==> Test plan >> Tread Group >> Add>> Logic Controller >> Recording controller
Recording controller will look like as below:
4) Now add the HTTP(S) Test Script recorder
HTTP(S) Test Script recorder will look like as below:
Also make sure the URL patterns to be included. I need only .html so added as below,
5) Now click on Start button and type on the Firefox browser with input url name and subsequent actions that you want to consider for performance test recording.
Jmeter scripts Adding scripts manually
Apache JMeter is a Java based performance testing tool works well on web communication layer (HTTP).
How to create Jmeter scripts?
There are two ways
1) Manually adding scripts ( Test plan >> Tread Group >> Add>> Sampler >> HTTP Request )
2) Recording using Jmeter’s HTTP(S) Test Script recorder
How to manually add Jmeter scripts
1 Follow the path : Test plan >> Tread Group >> Add>> Sampler >> HTTP Request as copied in the below screenshot
Below the fields needs to be filled when you write a code,
1) Name: you can give any logical name based on application (e.g Login, Home page etc)
2) Server Name or IP : it’s nothing but the IP of your server or the url name (www.your test site.com or “your test site.com” as example or if you know the IP, provide the IP)
3) Path : is “/sso/auth” in this example screenshot below as the remaining contents in the url after “.com” – if your original site is www.your test site.com/sso/auth
4) Make sure the Method è POST and protocol can be HTTP or HTTPS – which ever protocol is used.
Jmeter Performance test scenario – Creating a Jmeter Performance test scenario
Thread Group: Thread group is the number of virtual users performing the transaction on application under test.
How to add Thread group?
- Right click on the TestPlan
- Select Add>Thread Group from the popup.
How we design the user transactions or thread group?
As per below screenshot –
1) The requirement shows that number of threads or user actions needed as 60
2) Ram up time is given as 180 sec
3) This indicates that a delay of 3 sec between transactions are applied.
This will ensure that the 60th thread or user will be starting the action at 180th sec.
Here this example is selected based on user requirement or to verify performance metrics.
Jmeter Installation steps
- Download JMeter from (http://jmeter.apache.org/download_jmeter.cgi ) è by clicking the on the “apache-jmeter-2.13_src.zip md5 pgp” link (Binaries or Source)
- Extract the contents to a folder from ZIP file.
- Open the DOS command prompt (Flow: click on Start menu, Type cmd).
- In DOS screen – Navigate to the <JmeterHome>\bin directory.
- Type Jmeter.bat in the above mentioned command prompt. That will bring the Jmeter application ready for performance testing.
- Or click on Jmeter.bat file listed in <JmeterHome>\bin should bring the application.
Apache JMeter features and uses:
Apache JMeter is a performance tool developed in Java.
Supports both load and performance tests,
Supports different applications/server/protocol types,
Web – HTTP, HTTPS – i.e application made in Java, NodeJS, PHP, ASP.NET etc
SOAP / REST Webservices, FTP , LDAP & TCP etc.
Additionally it supports Database via JDBC, Message-oriented middleware via JMS, Mail – SMTP(S), POP3(S) and IMAP(S), also Native commands or shell scripts & Java Objects
Application behavior is the main focus on BDD. The requirements are written in English which gives more readability and understandability of the requirement.
So any roles in the company like Tester, developer, end user, and techno functional person can read it and understand it. Also this will reduce the complication in terms of missing requirement or misrepresenting or misunderstanding requirements between different roles like Developer , tester , end user etc.
Gherkin is a business readable language, refer below for an example. Below feature file is integrated with Selenium and are having user stories as below.
Please refer below – “feature, Scenario, Given, When, And, Then “are the Keywords below to understand on how to write a feature file.
What is Feature file in Cucumber test and how to create a feature file.
Feature file is a part of Cucumber framework and it contains descriptions in English language.
Hadoop – is a Java based programming framework that supports the processing of large data sets in a distributed computing environment
Hadoop – is based on Google File System (GFS)
Hadoop – uses thousands of nodes this is the key to improve performance.
Hadoop – is a Distributed File System or HDFS, which enables fast data transfer among the nodes.
Hadoop Configuration – has got the three modes of Hadoop configuration – Standalone, pseudo distributed, and fully distributed.
Hadoop MapReduce – Hadoop MapReduce is the core components of Hadoop and is a programming model and helps implementation for processing and generating large data sets, it uses parallel and distributed algorithms on a cluster. it can handle large scale data: petabytes, exabytes.
Mapreduce framework converts each record of input into a key/value pair.
Ubuntu Server – Ubuntu is a leading open-source platform. it helps in utilizing the infrastructure to users when they want to deploy a cloud, a web farm, or a Hadoop cluster.
HadoopDistributed File System (HDFS)- HadoopDistributed File System (HDFS) is a block-structured, distributed file system.
Distributed Cache – Distributed Cache is a Hadoop feature that helps cache files needed by applications.
Pig – is an Apache open-source project and one of the components of the Hadoop eco-system.
Pig – is a high-level data flow scripting language and runs on the Hadoopclusters.
Pig – uses HDFS for storing and retrieving data and Hadoop MapReduce for processing Big Data.
Hive – is a data warehouse system for Hadoop.
Hive – facilitates ad hoc queries and aids analysis of data sets stored in Hadoop.
Hive – provides an SQL like language called HiveQL(HQL)
Apache HBase – is a distributed, column oriented database.
Apache HBase – is built on top of HDFS.
Apache HBase – is an open-source, distributed, versioned, non relational database system.
Apache HBase – has two types of Nodes. 1. Master and 2. Region Server.
Cloudera – is a commercial vendor for deploying Hadoopin an enterprise.
Cloudera – offers ClouderaManager for system management, ClouderaNavigator for data management.
ZooKeeper – is an open source and high performance co ordination service for distributed applications.
Pivotal HD – is a commercially supported, enterprise capable distribution of Hadoop and it aims to accelerate data analytics projects.
Sqoop – Sqoop is an Apache Hadoop ecosystem project. Sqoop’s responsibility is to import or export operations across relational databases.
Apache Oozie – is a workflow scheduler system used to manage Apache Hadoop jobs/MapReduce jobs
Mahout – is library of machine learning algorithams, helps in clustering and Clustering allows the system to group various entities into separate clusters or groups based on certain characteristics or features.
Apache Cassandra – Apache Cassandra is an open source, freely distributed, high-performance, extremely scalable, and fault-tolerant post relational database.
Apache Spark – is a powerfull open source processing engine and general MapReduce like engine used for large-scale data processing.
Apache Ambari – Apache Ambari is a completely open operational tool or framework for provisioning, managing, and monitoring Apache Hadoop clusters.
Kerberos – is a third party authentication mechanism. It has a database of the users/services and their respective Kerberos passwords.
1) Under Windows menu >> HP Software >> Click on Virtual user generator menu to open HP Virtual user generator application (if you already have HP LoadRunner is installed on machine)
Note 1: if you are not sure about the protocol, use the protocol adviser in the “Virtual user generator” application and scan the application to find out best matching protocols (refer Snapshot 2 below)
Note 2: for web applications usually “Web – HTTP/HTML” is the protocol, you add additional protocols for database e.g ODBC or Oracle.
Snapshot 1
Snapshot 3
Snapshot 4
HP LoadRunner – how to use Virtual user generator.
1) Under Windows menu >> HP Software >> Click on Virtual user generator menu to open HP Virtual user generator application (if you already have HP LoadRunner is installed on machine)
2) Select the protocol – refer Snapshot 1 below.
Note 1: if you are not sure about the protocol, use the protocol adviser in the “Virtual user generator” application and scan the application to find out best matching protocols (refer Snapshot 2 below)
Note 2: for web applications usually “Web – HTTP/HTML” is the protocol, you add additional protocols for database e.g ODBC or Oracle.
Snapshot 1
Snapshot 2
3)
Click on create button in the above snapshot
2. Enter url as copied below in snapshot
3. Then Click start recording
Snapshot 3
4) Once your application pop us – start doing the business transactions which you wanted to do. You will see recording status is updated as below (adding time – below snapshot 4 shows 2.58 min recording )
Snapshot 4
5) Once the code is developed – HP LoadRunner Controller is used to setup the scenario – refer the Performance best practices to get the flow.
LoadRunner version 12.53
I am yet to try the trial version of LoadRunner 12.53, However I read the following are some of the features shall be available for users
Git integration in VuGen
REST step builder editor in VuGen
64-bit replay support in various Java protocols and C Vuser protocol
New PCoIP remote access protocol
Enhanced SAPUI5 recording in TruClient
HTTP Video Streaming (HTML5, HLS) support
JSON manipulation APIs
Web – HTTP/HTML and Mobile Application – HTTP/HTML protocol unification
Linux load generator improvements
Enhancements to Java-based protocols etc are main features that I would like to try..
Load balancing testing.
Load balancing is a method of balancing the network traffic to make sure network transactions are distributed across all the servers. for e.g if a server fails during heavy applied in them, load balancer will redirect the transactions to remaining servers. Basically Load balance acts as a reverse proxy. During performance testing this feature is tested usually.
Performance testing vs Load testing vs Stress testing vs Endurance testing
1. Performance testing – The main purpose of Performance testing is to arrive the benchmark & baseline of the system behavior (e.g response time) under normal/moderate load. This test will help performance engineer to analyse how does the application behave under normal conditions.
2. Load testing – here load will be constantly and steadily increased over a given period of time. i.e the constant load applied for a constant period of time. For example a load of 100 users are applied for 15 min.
3. Stress test – it is meant to push the system beyond the normal load limits or extreme conditions. This test is to make sure the servers don’t crash or what point it crashes. Stress test will verify the breaking point of the system or how much load, system can withstand.
For example a load of 100 users are applied for 15 min and then 150 users load is applied for next 15 min. then 200 users load is applied for next 15 min. Verify at what point system stopped to respond.
4. Endurance testing – for easy understanding, I would say it is a “Load testing on extended period” to make sure web servers are performing longer period of time. For example a load of 100 users are applied for 48 hours
Note: Once the performance testing is completed successfully, tester can assume the performance requirements are met and he can start load testing. After that Stress testing if required.
Load testing tools in the market are
1) HPE LoadRunner is from Hewlett Packard Enterprise.
2) JMeter – Apache JMeter. It is a Java based performance testing tool works on web communication layer (HTTP)
Loadrunner components
Vuser generator – used for generating Scripts
Controller – used for creating and executing scenarios
Analyzer – used for analyzing results
Performance test analysis can be done real time script execution or post execution
Real time script execution analysis
1) Performance Engineer needs a coordination with other teams like Database team, app server team, etc to monitor real time performance on Database server, Application server
2) Database and app server team can let Performance Engineer know the performance results on these servers like resource utilization, fail over server works / load balancing works fine etc.
Post script execution analysis
1) Verification on Vuser metrics, Vuser errors, can be validated.
2) Verification Transactions graphs for TPS, response time, hits per second can be reviewed.
For additional details please click on click link load testing vs performance testing vs stress testing
Performance testing best practices and activities.
Performance test analysis.
What is Performance test analysis?
Performance test analysis can be done real time script execution or post execution
Real time script execution analysis
1) Performance Engineer needs a coordination with other teams like Database team, app server team, etc to monitor real time performance on Database server, Application server
2) Database and app server team can let Performance Engineer know the performance results on these servers like resource utilization, fail over server works / load balancing works fine etc.
Post script execution analysis
1) Verification on Vuser metrics, Vuser errors,
2) Verification Transactions graphs for TPS, response time, hits per second etc.
For additional details please click on click link //shalimatech.com/load-testing-vs-performance-testing-vs-stress-testing/
Performance testing best practices and activities.
As first step, Performance Engineer needs to learn the requirements, performance expectations & system architecture.
Note: To learn the performance requirements & expectations, SME (Subject matter expert ) or production user can help. This information will help to define performance goals and SLAs
Then develop best matching performance test scenarios, approach, define goals (SLAs) & sign off test plan.
Note 1: To identify the right performance test scenarios, SME can give some feedback on about the current performance issues in production / live application that he/she is facing.
Note 2: You can refer another blog of mine on different types of performance scenarios – click link load testing vs performance testing vs stress testing
Now Performance Engineer can developer V– USER scripts and execute the scripts in Controller to generate performance analysis results
Note 1: Apart from delivering performance analysis results, Performance Engineer can coordinate with other team to monitor real time performance on Database server, Application server and also make sure load balancing is working fine while stress testing.
Some of the e.g. when performance testing is needed
for Database upgrade,
Application upgrade,
Or if user complains that application performance is bad – like page response is not meeting his/her expectations.
Basic knowledge required to work on QTP/UFT projects
1. Basic programming knowledge on VB scripting – just to modify the recorded scripts. QTP/UFT allows record/play back, using that application transactions can be recorded and later modified based on requirements. Need to learn usage of functions. Instead of functions, QTP/UFT inbuilt feature “reusable” actions can be used.
2. Looping and Parameterization – Parameterization is required to change the already recorded data. Basically the user id, password, input values to be entered in the AUT. To repeat a transaction, looping is used. For looping “For-Next” , “Do-while” etc are used
3. Object Spy & Object Repository– QTP developer can view the run-time/Application object properties and methods of any object in the application. This is helpful during debug mode and find out Dynamic objects. Object Repository is the place where recorded objects are stored by displaying the object properties and values. QTP developer can do some changes on values – using regular expression as an example to handle Dynamic objects.
4. Import / Export data sheet – This is used for very basic reporting where coding is done to store AUT values, some error validations and input values in QTP datasheet or already imported spreadsheet.
QTP/UFT related topics
How to do parameterization in UFT/QTP
How to do smart identification in QTP
How to setup Recovery scenario’s in QTP/UFT
Select Case example for QTP script development
X = RandomNumber(1,4)
Select Case X
Case 1
msgbox ” number is 1″
Case 2
msgbox ” number is 2″
Case 3
msgbox ” number is 3″
Case Else
msgbox ” number is 4″
End Select
How to connect Oracle using QTP scripts.
Dim connectionMS, recordsetMS
Set connectionMS = createobject(“adodb.connection”)
Set recordsetMS =createobject(“adodb.recordset”)
connectionMS.open “Driver={Microsoft ODBC for Oracle};Server=QTPWorld; Uid=your_username;Pwd=your_password;”
recordsetMS.open “select * from yourtablename”,connectionMS
databaseValue = recordsetMS.fields.item(0)
msgbox databaseValue
Set connectionMS = nothing
Set recordsetMS = nothing
How to connect sqlserver using QTP scripts.
Dim connectionMS, recordsetMS
Set connectionMS = createobject(“adodb.connection”)
Set recordsetMS =createobject(“adodb.recordset”)
connectionMS.open”Driver={SQL Server};server=YourSqlServer;uid=YourUserName;pwd=YourPassword;database=dbname”
recordsetMS.open “select * from tablename”,connectionMS
databaseValue = recordsetMS.fields.item(0)
msgbox databaseValue
Set connectionMS = nothing
Set recordsetMS = nothing
How to connect MS Access using QTP scripts and display results
Dim connectionMS, recordsetMS
Set connectionMS = createobject(“adodb.connection”)
Set recordsetMS =createobject(“adodb.recordset”)
connectionMS.provider= “microsoft.jet.oledb.4.0”
connectionMS.open “C:\yourdatabase.mdb”
recordsetMS.open “select * from YourtableName”,connectionMS
databaseValue = recordsetMS.fields.item(0)
msgbox databaseValue
Set connectionMS = nothing
Set recordsetMS = nothing
QTP program to display odd and even numbers
‘ program to display odd numbers
Dim OddNum, o
o = Inputbox(“enter any value to check list of odd numbers in it”)
For OddNum = 1 To o Step 2
print OddNum
Next
‘ program to display even numbers
Dim EvenNum, e
e = Inputbox(“enter any value to check list of even numbers in it”)
For EvenNum = 2 To e Step 2
print EvenNum
Next
How to do string reverse in qtp
How to do string reverse in qtp
Dim String1, String2, StringLength, i
String1 = “Happy Valentine’s Day”
StringLength = len(String1)
For i = StringLength To 1 step -1
String2 = String2 & mid(String1, i, 1)
Next
Msgbox String2
String reverse in qtp
Dim String1, String2, StringLength, i
String1 = “Shalima Prakash”
StringLength = len(String1)
For i = StringLength To 1 step -1
String2 = String2 & mid(String1, i, 1)
Next
Msgbox String2
1. Period (.) is used to represent or replace any symbol except new line
2. Asterisk (*) represents zero or more occurrences
3. Caret (^) sign instructs beginning of the line
4. Dollar ($) sign instructs end of line
5. \b instructs Word boundary
6. ? instructs zero or more occurrences
7. + instructs one or more occurrences
8. {} represents exact number of occurrences
9. [] represents any character in the set
10. [^] represents any character NOT in the set
11. () represents Group
12. I represents Or
13. \n represents new line
14. \W represents any non-Word character
15. \d is any digit
16. \D is any non-digit
17. \s is any white space character
18. \S is any non- white space character
19. \ is escape special character
How to setup Recovery scenarios in QTP/UFT
To handle unexpected errors, popup etc , QTP/UFT uses this feature (also when existing code is not designed to handle this issue)
1. Navigate to Resources > Recovery Scenario Manager
2. Click on below marked icon. Select the trigger (here is Pop up window)
3. Now record the trigger – if required Regular expression can be added. It will add window title automatically.
4. Now select the recovery operation.
5. After recovery operation go to post recovery operation as copied
below
Smart identification is needed when recorded script fails to recognize the application object (it may be due to multiple objects has same properties/values or recorded property value is changed)
Smart identification uses additional 2 set of object identification layers (1. Base filter properties 2. Optional filter properties) apart from regular mandatory, assistive properties.
1. To get smart identification enabled – navigate Tools > Object identification.
1 object identification
2. On object identification window – click on configure to add 1. Base filter properties 2. Optional filter properties as shown below.
2 object identification properties Descriptive programming in UFT
What is Descriptive Programming?
Descriptive programming is a way writing and implementing QTP scripts by avoiding the object repository. Usually Non – Descriptive programming access this object repository, where the required object’s properties and values are stored, and execute the scripts.
While in Descriptive programming, the object properties and values are directly written in the code so no need to access the object repository while script execution time.
For example.
If QTP script needs to close a browser the following descriptive program can be used and it can close any single open browse no matter what is the content or name of the browser.
Browser(“micClass:=Browser”).close
What are the common ways that the Descriptive Programming scripts can be written?
1. Static Descriptive Programming
Here the object properties and values are directly written in the code assuming that we know the expected properties and values.
For example.
If scripts wanted to input user name and password and click ok button to login to an application.
Browser(“micClass:=Browser”).Page(“micClass:=Page”).WebEdit(“type:=text”,”name:=username”).set “– USERNAME”
Browser(“micClass:=Browser”).Page(“micClass:=Page”).WebEdit(“type:=text”,”name:=password”).set “PASSWORD”
Browser(“micClass:=Browser”).Page(“micClass:=Page”).WebButton(“type:=Button”,”name:=Login”).set “LOGIN”
2. Dynamic Descriptive Programming
Here the object properties and values collections are created and used while scrip execution time
‘ this is to declare the object variable
Dim oDesc
‘to create an blank description
Set oDesc = Description.Create
Now assign values to the blank description in “oDesc”
oDesc(“type”).value= “text”
oDesc(“name”).value= “username”
now implement it in code as below
Browser(“micClass:=Browser”).Page(“micClass:=Page”).WebEdit(oDesc).Set “– USERNAME”
Note: Dynamic Descriptive Programming is really helpful when you want to handly an array of objects and child objects.
How to view source code on HTML code using Chrome or Firefox browser.
1) Open browser in Chrome or in Firefox
2) Type “view-source:url “ for e.g view-source:shalimatech.com type in Chrome/Firefox browser, that will show the HTML code .
Selenium supports Cross Browser Testing. The Selenium tests can be run on multiple browsers and multiple machines and multiple Operating systems.
Supports several scripting languages like Java, Python, C#, and PHP
Selenium uses Browser native commands. It locates and actions applied on UI elements,
Reporting are very easy and extensible.
TestNG quick summary:
TestNG’s is Selenium + reporting features. It is easy to generate reports using Listeners and Reporters in TestNG
Features of TestNG includes the following,
1) Annotations – please refer my annotation blogAnnotation – TestNG’s test case priority
2) Supports parameterization/ data driven testing
3) Test cases can be grouped and parallel testing is allowed.
Automaton testing using Cucumber – Behavior driven development (BDD)
Application behavior is the main focus on BDD. The requirements are written in English which gives more readability and understandability of the requirement.
So any roles in the company (Tester, developer, end user, and techno functional person) can read it and understand it. Also this will reduce the complication in terms of missing requirement or misrepresenting or misunderstanding requirements between different roles (Developer /tester / end user)
Gherkin is a business readable language – refer below for an example. Below feature file is integrated with Selenium and are having user stories as below.
Please refer below – “feature, Scenario, Given, When, And, Then “are the Keywords below to understand on how to write a feature file.
What is TestRunner in Cucumber
In order to link Cucumber with Selenium WebDriver, you need to start a Java project in eclipse IDE.
Then, add both Cucumber and Selenium jar files
Write test runner code and execute the same .